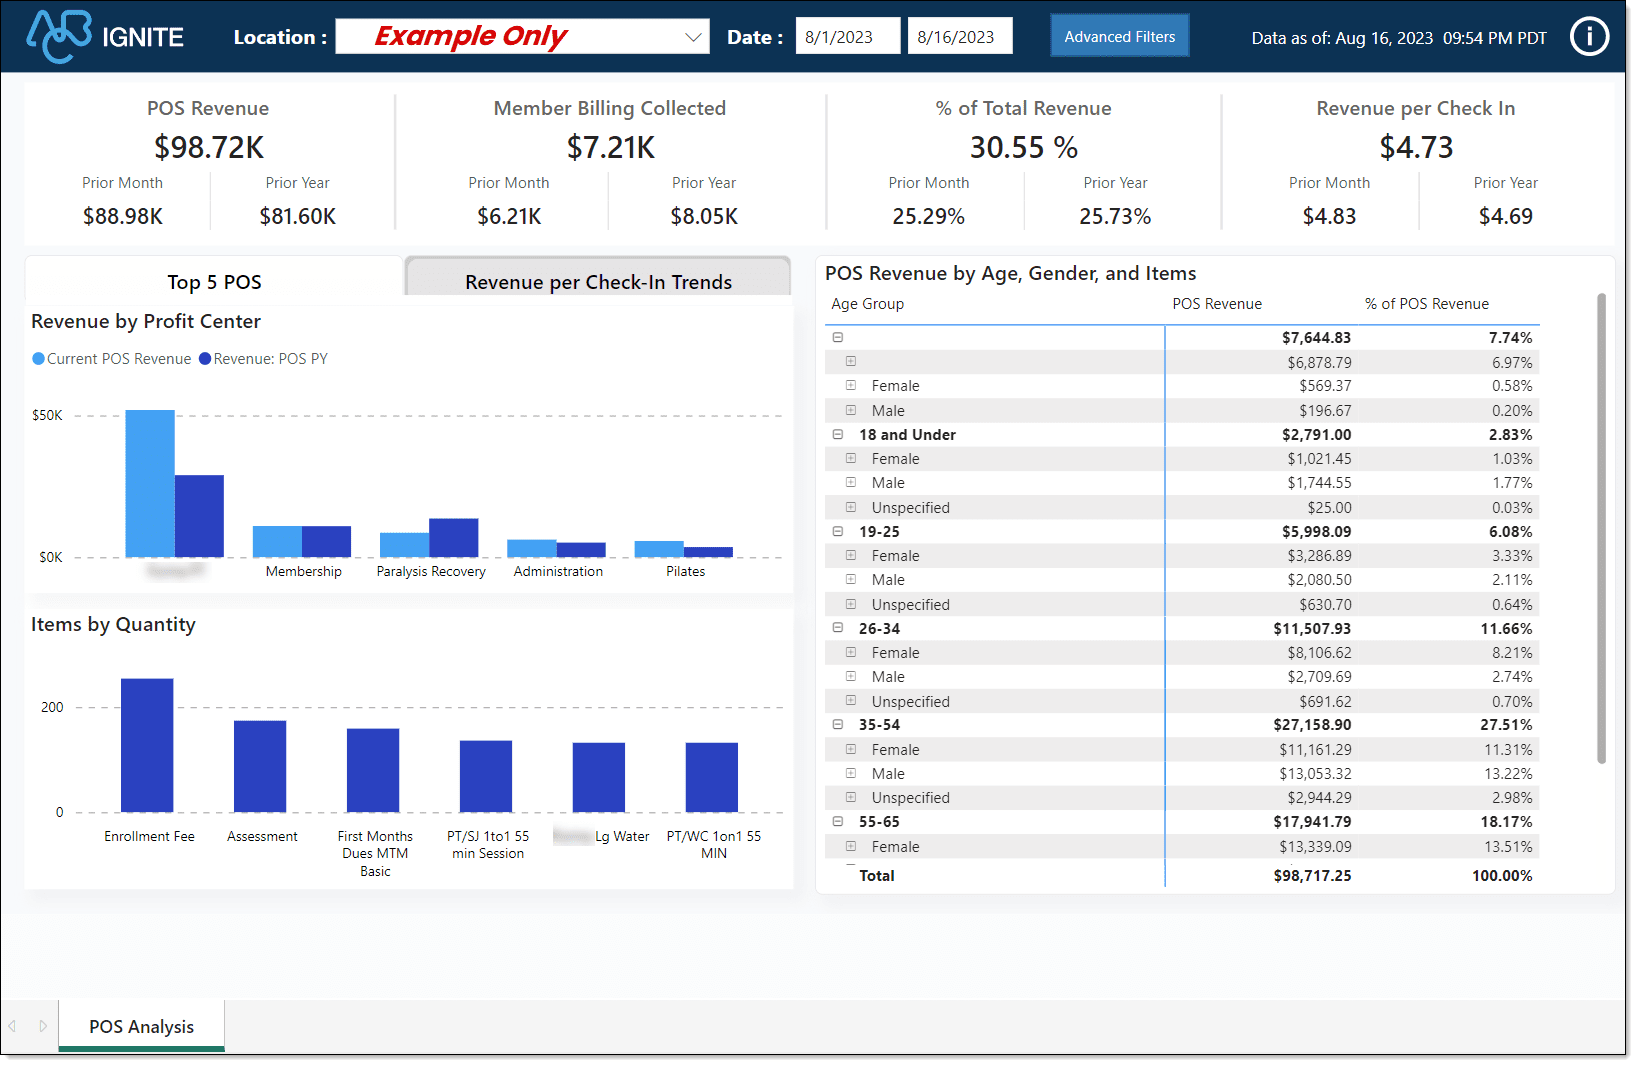
POS Analysis Dashboard
Summary
The POS Analysis dashboard provides insights into the revenue generated through point-of-sale transactions within your business. This comprehensive report offers a detailed view of revenue trends based on the day of the week and the popularity of specific items sold.
By examining these transactional details, the POS Analysis dashboard enables you to make informed decisions about various aspects of your operations and strategies.

|
Tip: This dashboard supports both billing platforms, Commerce and legacy iSeries. |
When to Use
The POS Analysis dashboard is an invaluable resource for gaining insights into the revenue generated through point-of-sale transactions. It empowers you to optimize operations, enhance customer experiences, refine marketing strategies, and make well-informed decisions that contribute to the overall success and growth of your business.
Below are a few examples of using this dashboard.
-
Sales Performance Evaluation
-
Staff Scheduling and Allocation
-
Inventory Management
-
Marketing and Promotions
-
Pricing Adjustments
-
Budgeting and Financial Forecasting
Key Performance Indicators (KPIs)
This dashboard includes the following key metrics and charts.
Key Performance Indicators (KPIs)
-
POS Revenue: Shows the total amount collected for all transactions from the point of sale, including the prior month and the prior year. Also, this shows the POS revenue for the same period in the prior month and prior year.
-
Member Billing Collected: Shows the total amount of billing collected at POS. This KPI also shows the member billing collected for the same period in the prior month and prior year.
-
% of Total Revenue: Compares POS revenue with all revenue. This percentage is calculated by dividing the POS revenue amount by the total revenue amount.
-
Revenue Per Check-In: This metric is calculated by dividing the POS Revenue (excluding member billing and club account) by the total count of member check-ins. Also, this shows the revenue per check-in collected for the same period in the prior month and prior year.
Charts
-
Top 5 POS: This tab shows revenue by profit center and the top five catalog items members purchased, including the quantity.
-
Revenue Per Check-In Trends: This tab shows POS Revenue Per Check-In and Check-In trends for the prior 12 months and by the day of the week. Hover the mouse over an item to view details.
-
POS Revenue by Age, Gender, and Items: Shows POS revenue grouped by demographic and the percentage a specific group spends compared to the total POS revenue. Select a row to expand the details.
Use the Advanced Filters option to customize the dashboard by membership type, gender, campaign name, entry source, primary member, and profit center.
Key Concepts
Check-In
Prior Month
Prior Year
Revenue
Revenue is the currency amount recorded for ABC collection and in-club transactions. The type of transaction is determined by the payment method set in Membership & Operations > Club Settings at the time of the transaction.
- Income - Transactions funded through an income payment method specified in Club Settings of Membership & Operations.
- Non-Income - Transactions funded through a non-income payment method specified in Club Settings of Membership & Operations.
Illustrations