Revenue Analysis Dashboard
View Document DetailsTopic Revised: 2024 04 30 T12:44:10 UTC; April 30, 2024 at 12:44:10Topic Created: 2024 04 26 T12:40:51 UTC; April 26, 2024 at 12:40:51Help System Last Build: 2024 05 03 T11:59:15 UTC
Summary
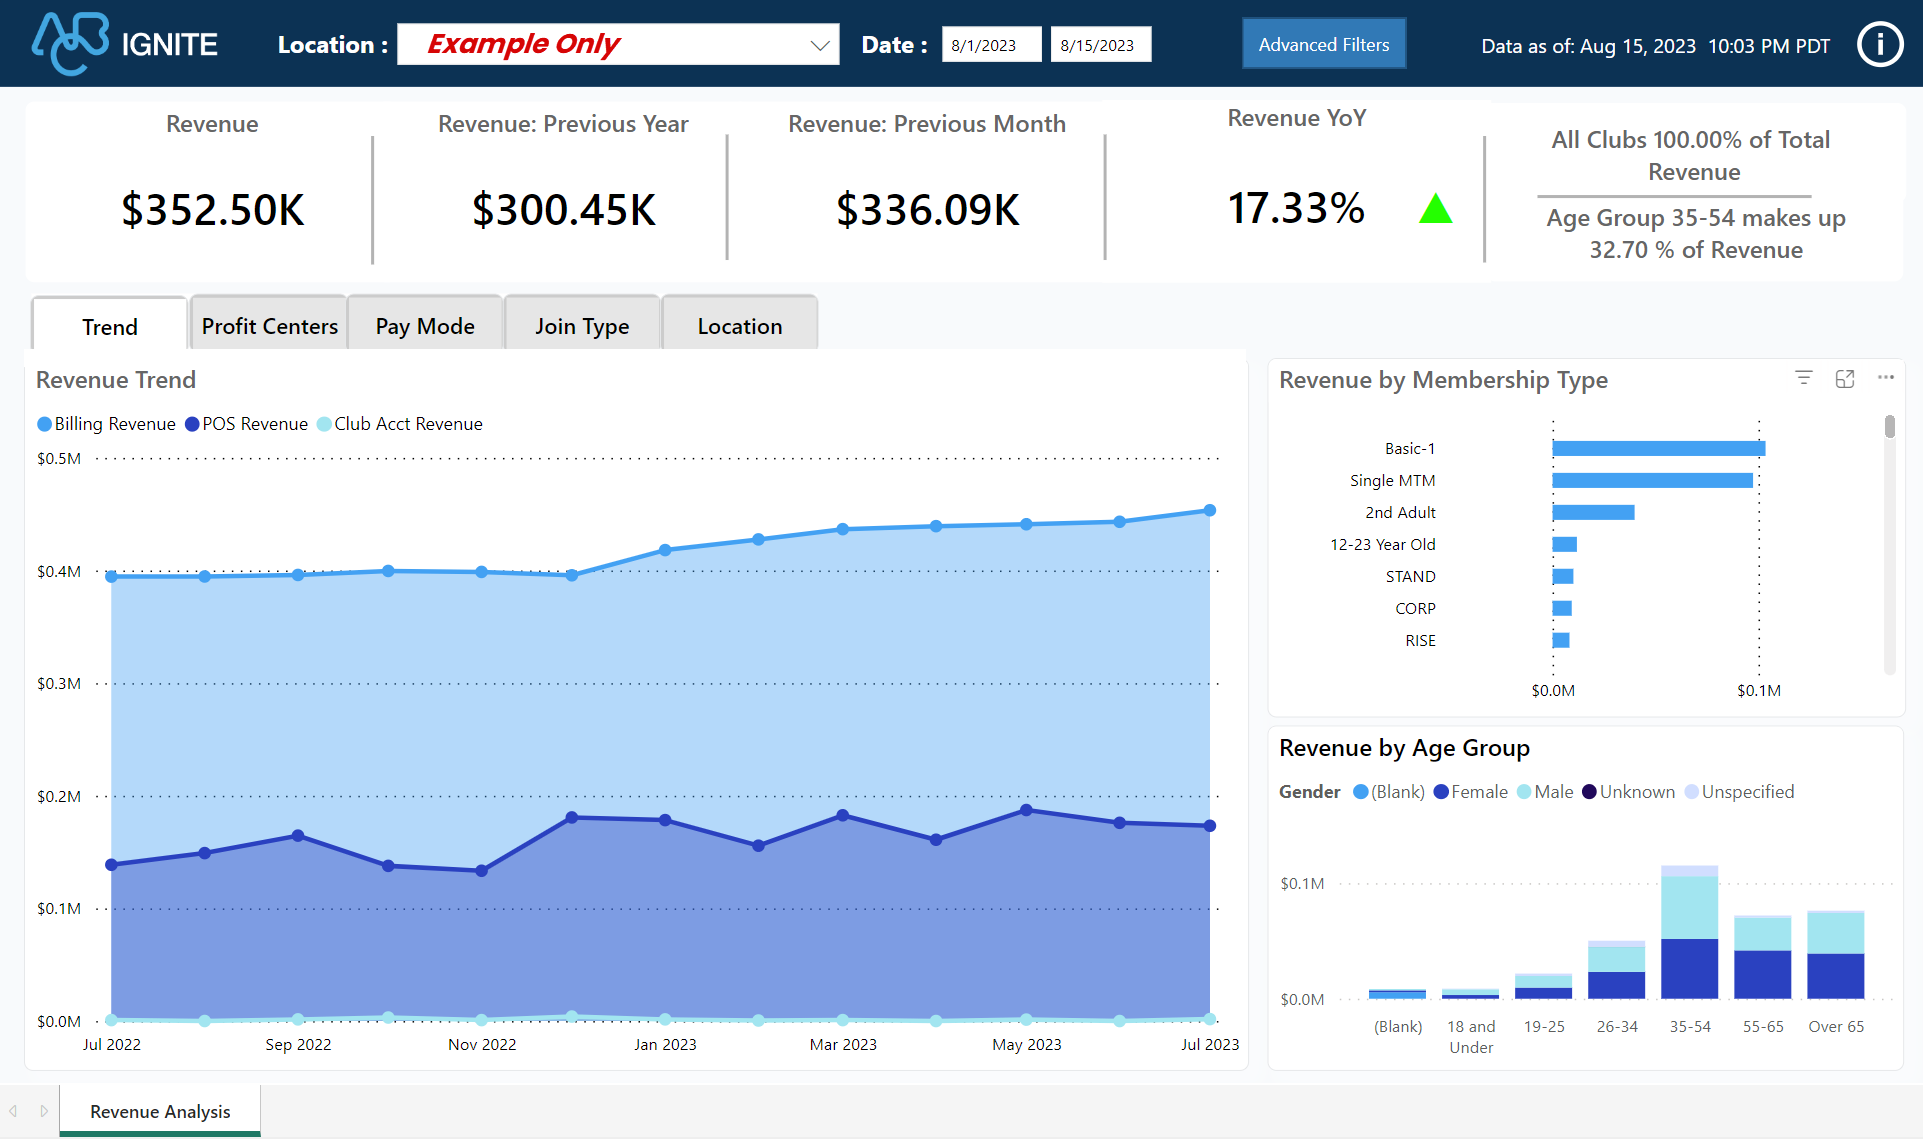
The Revenue Analysis dashboard shows revenue trends and breakdowns across your organization and products, including key demographic details about member purchases.
This dashboard is a valuable tool for assessing financial performance, understanding trends, making informed decisions, and strategically managing your club's growth and profitability.

Commerce and iSeries Dashboard
This dashboard supports both billing systems, Commerce Transact and iSeries.
When to Use
Use the Revenue Analysis dashboard to examine the revenue generated over a specific time period and to gain a deeper understanding of the factors that contribute to your income.
Below are a few examples of using this dashboard.
-
Business Performance Evaluation
-
Budgeting and Planning
-
Identifying Peak Seasons
-
Marketing Strategy Assessment
-
Pricing Strategy Evaluation
-
Product and Service Analysis
Key Performance Indicators (KPIs)
Key Performance Indicators
The Revenue Analysis dashboard includes the following metrics and charts.
Key Performance Indicators (KPIs)
-
Revenue: Shows total revenue for the selected date range. This includes the revenue across billing, POS, etc.
-
Revenue: Previous Year: Shows the total revenue for the prior year.
-
Revenue: Previous Month: Shows the total revenue for the prior month.
-
Revenue YoY: Shows a percentage of revenue comparing this year with the prior year. To calculate Revenue YoY:

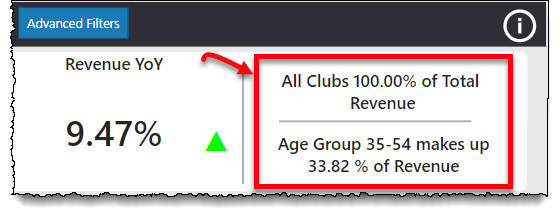
The narrative widget, shown below, near the top right of the dashboard shows the contribution of the selected club to the overall revenue and the membership type contributing to the maximum club revenue.
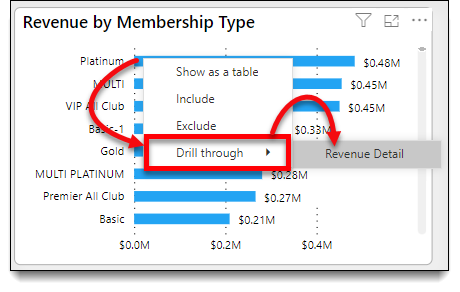
Several charts have a drill-through feature, allowing you to view specific details about the data. To drill through to a detailed report, right-click the chart item, select Drill through, and select a desired detail option.
Charts
Chart
Note: An asterisk (*) denotes the chart has the drill-through feature.
-
Revenue Trend*: This tab shows billing, club account, and POS revenue trends for the previous 12 months from the current date.
-
Revenue by Profit Centers*: This tab shows billing, club account, and POS revenue by profit center.
-
Revenue by Pay Mode*: This tab compares revenue by source for the selected date range. Select a source to view details:
-
Point of Sale (POS) Revenue: Revenue collected at the club. This excludes member billing and club account payments made at the club.
-
Billing Revenue: Revenue collected by ABC Fitness Solutions. This includes new, upgraded, and transferred memberships and payments made at the club.
-
Club Account Revenue: Revenue collected for club account payments, including recurring services.
-
-
Revenue by Member Join Type*: This tab shows revenue by agreement type. The trend shows the previous 12 months from the current date. Refers only to membership dues revenue.
-
Revenue by Location: This tab shows revenue by club location for the selected date range.
-
Revenue by Membership Type*: Shows revenue by membership type for the selected date range.
-
Revenue by Age Group*: Compares the selected date range revenue with member age and gender.
Use the Advanced Filters option to customize the dashboard by membership type, gender, campaign name, entry source, primary member, and profit center.
Essential Definitions
Prior Month
Prior Year
Revenue
The currency amount logged in the collection transaction by ABC and in-club transactions comprises revenue. The payment method's setting at the time of the transaction determines the categorization:
-
Income - Transactions that are funded using an income payment method as defined in the club settings.
-
Non-Income - Transactions that are funded using a non-income payment method as defined in the club settings.
Illustrations