Invoices Variance Analysis
Use this report to compare initial invoices or adjusted invoices across any two months and analyze the month-to-month changes. The two months selected do not have to be consecutive.
Summary Report
The Invoices Variance Analysis Summary provides an overview of projected invoice totals, the average projected invoice amount, and the total number of invoices for each selected month. Variance Analysis displays changes between the selected months.
You can navigate to the Profit Center Summary by clicking a profit center total.
Here is a sample of the Invoices Variance Analysis Summary:

| Section | Column | Description |
|---|---|---|
| Initial Invoices | Total Invoices | The number of active invoices in the ABC Billing System for the month. Total Invoices includes invoices for the selected months; past due and prior month invoices are not included. |
| Total Projected | The projected invoice total for the month. | |
| Average Projected | The average invoice amount, found by dividing the Total Projected amount by the Total Invoice count. | |
| Variance Analysis | Variance Amount |
The difference in Total Projected for the selected months, found by subtracting the prior monthly total from the most recent monthly total. |
| Rate Change | The difference in Average Projected, found by subtracting the most recent month's Average Projected amount from the prior month's Average Projected amount. | |
| Rate Variance |
Rate Variance = (Most Recent Month's Average Projected – Prior Month's Average Projected) x Most Recent Month's Total Invoices Example: (June 2017 Average Projected – May 2017 Average Projected) x June 2017 Total Invoices. |
|
| Volume Change |
The difference in Total Invoices, found by subtracting the prior month's Total Invoices from the most recent month's Total Invoices. Example: June 2017 Total Invoices – May 2017 Total Invoices |
|
| Volume Variance |
(Most Recent Month's Total Invoices – Prior Month's Total Invoices) x Prior Month's Average Projected Example: (June 2017 Total Invoices– May 2017 Total Invoices) x May 2017 Average Projected |
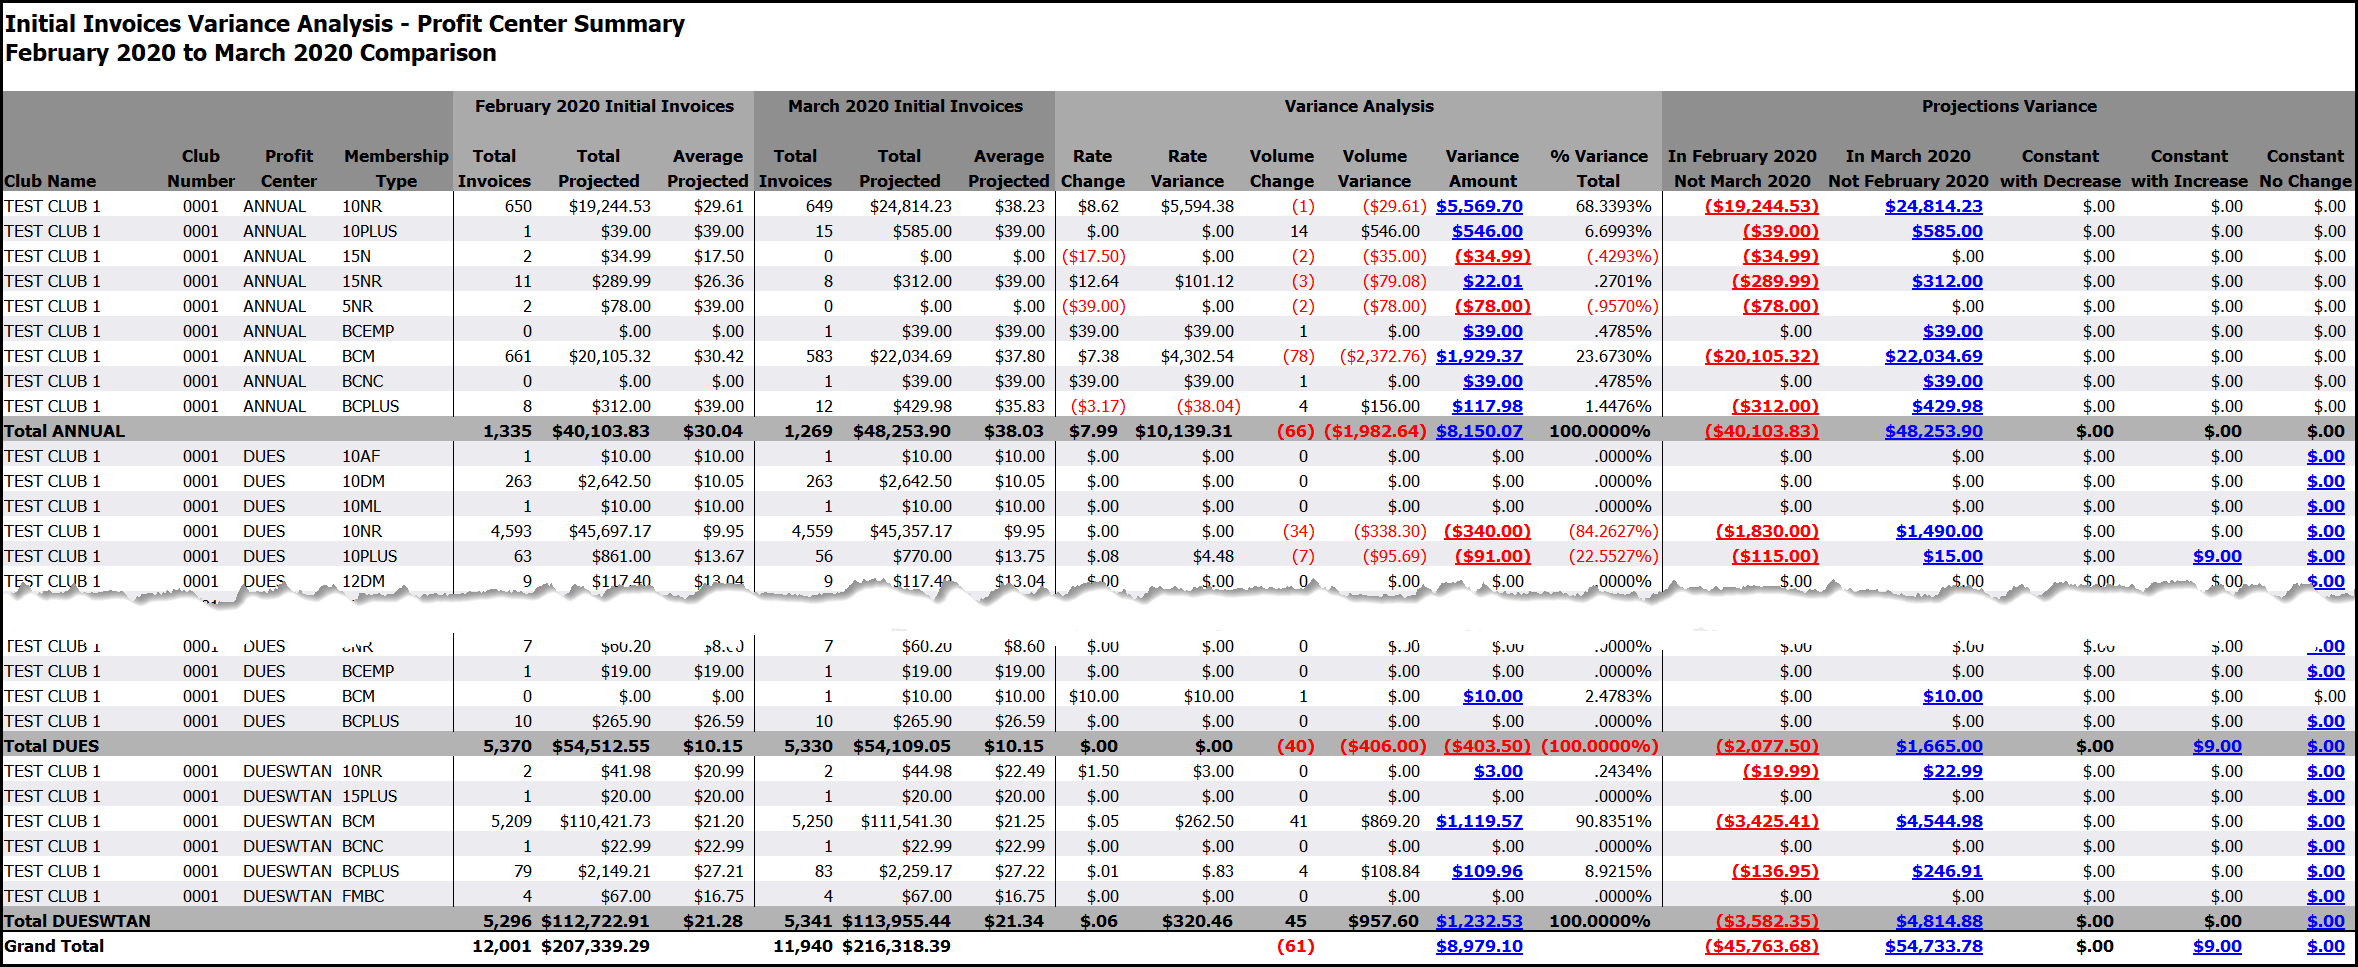
Profit Center Summary
From the summary report, you can click a profit center total to view the Profit Center Summary.

The Profit Center Summary provides an overview of monthly activity for the selected profit centers and displays Variance Analysis and Projections Variance. The Projections Variance section shows reasons for variance, including:
- Invoices which were available to collect in the former month but not the latter.
- Invoices which were available to collect in the latter month but not the former.
- Invoices which were available to collect in both months, but invoice amounts increased from the former month to the latter month.
- Invoices which were available to collect in both months, but invoice amounts decreased from the former month to the latter month.
- Invoices which were available to collect in both months, with constant invoice amounts from the former month to the latter month.

| Section | Column | Description |
|---|---|---|
| Variance Analysis | % Variance Total |
The percentage of variance for each membership type. |
| Rate Change |
The difference in Average Projected, found by subtracting the prior month's Average Projected from the most recent month's Average Projected. |
|
| Rate Variance |
Rate Variance = (Most Recent Month's Average Projected – Prior Month's Average Projected) x Most Recent Month's Total Invoices Example: (June 2017 Average Projected – May 2017 Average Projected) x June 2017 Total Invoices |
|
| Volume Change |
The difference in Total Invoices, found by subtracting the prior month's Total Invoices from the most recent month's Total Invoices. |
|
| Volume Variance |
Volume Variance = (Most Recent Month's Total Invoices – Prior Month's Total Invoices) x Prior Month's Average Projected Example: (June 2017 Total Invoices– May 2017 Total Invoices) * May 2017 Average Projected |
|
| Variance Amount | The difference between the most recent month's Total Projected amount and the prior month's Total Projected amount. |
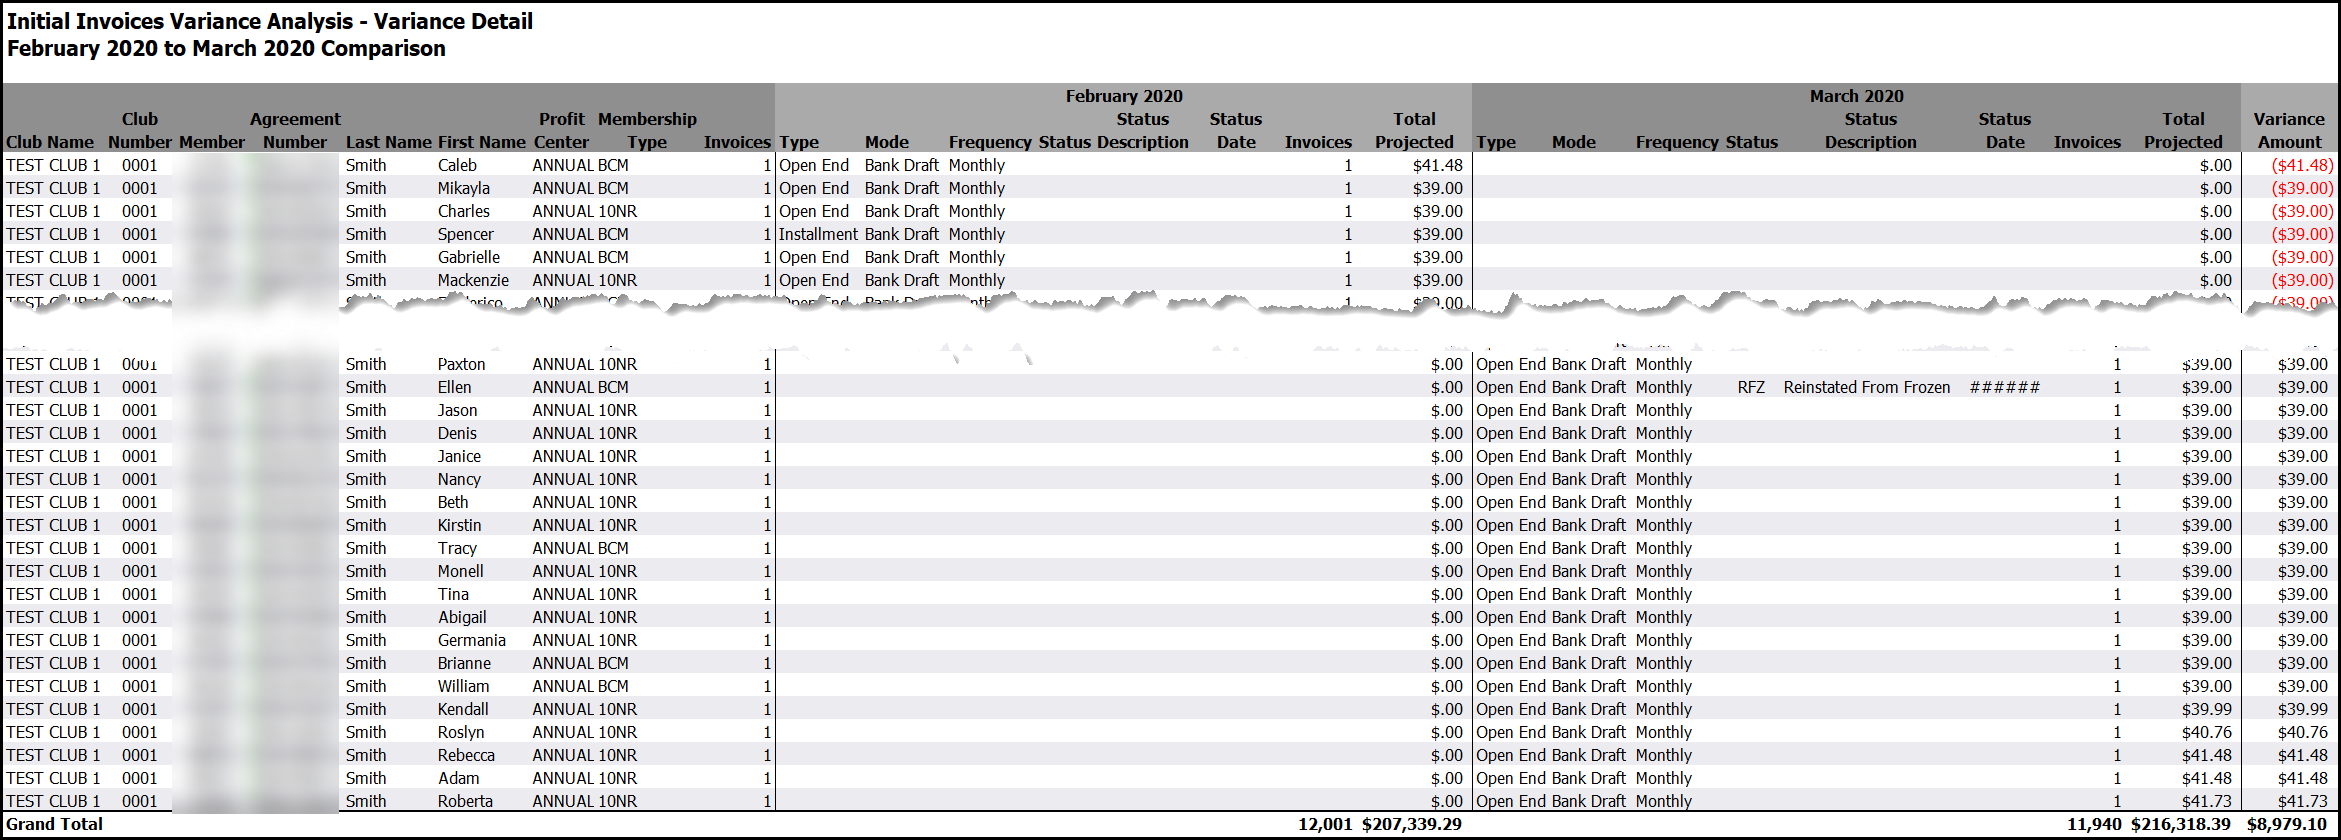
Member Detail Report
From the report summary, you can access Member Detail reports by clicking a Variance Amount.
From the Profit Center Summary, all hyperlinks lead to associated member detail reports.
A sample Member Detail report is displayed below.

Automated Report
This report is available for automated delivery! The automated report is available in Excel or PDF format. Single club reports will include detail reports. Multiple club reports will include summaries for each selected club.
To receive the report via e-mail, please complete the automated report setup checklist and submit it to ABC on the ABC CRS Client Request Form. Click