Report Overview
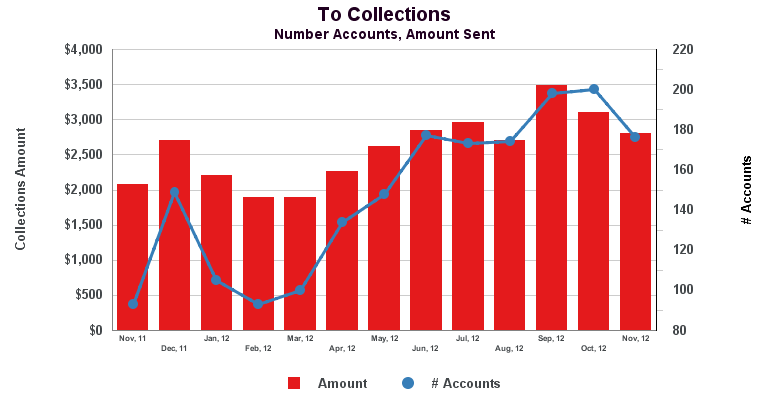
The Accounts and Amounts to Collections chart shows a month-by-month comparison of the number of accounts and the amount sent for those accounts to collections.
If you'd like to see this information in report form, consider using Agreement Entry/Exit Totals.
Data is available beginning January 1, 2015.
The time range for a month in this graph is the end of the previous month amount plus the mid-month amount.
To obtain the number of accounts displayed in this graph:
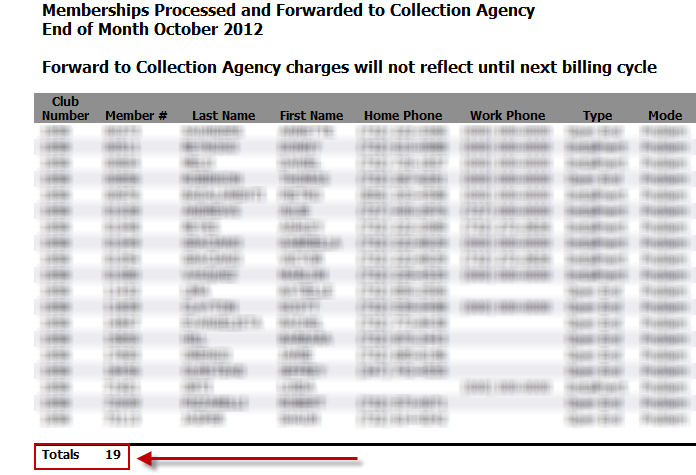
1. Run the RFC to Agency or RFC Preview report as End of Month for the previous month. For example, to obtain the November 2012 number, run this report as End of Month for October 2012.
Click to see an example.
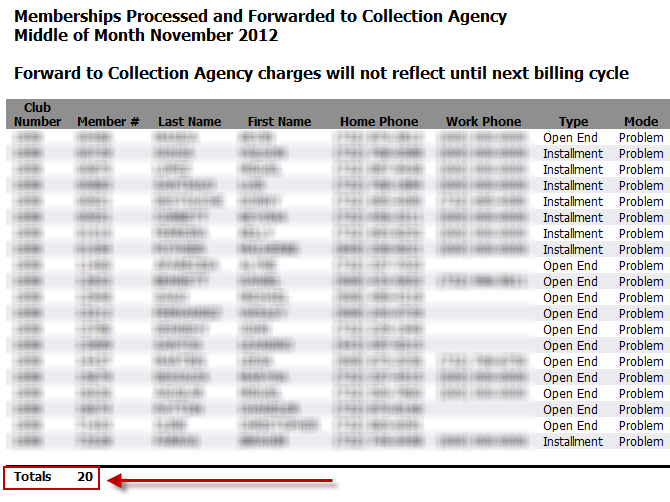
2. Run the RFC to Agency or RFC Preview report as Mid Month for the month you are viewing. For example, to obtain the November 2012 number, run this report as Mid Month for November 2012.
Click to see an example.
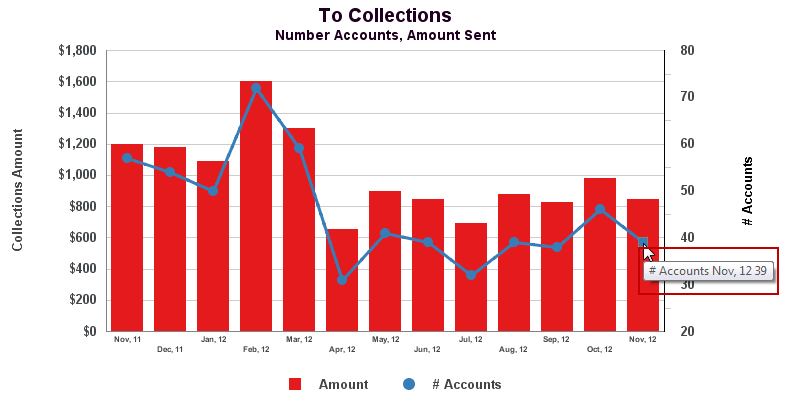
3. Add the totals from these two reports. The sum will be the number of accounts displayed on the graph.
Click to see an example.
Multiple Clubs
If you run the report for several clubs, all of the information is aggregated into a single chart.
To find out the number of accounts in one section of the chart, move your mouse over the section.
Sample Report
Here is an example of the Accounts and Amounts to Collections chart:
